 |
Next: Reducing SCUBA Data at the James Clerk Maxwell Telescope
Up: Data Analysis Applications
Previous: ASC Coordinate Transformation -- The Pixlib Library, II
Table of Contents -- Index -- PS reprint -- PDF reprint
S. Huth1,2 and B. Schulz2
(1) Max-Planck-Institut für Astronomie, Königstuhl 17,
69117 Heidelberg, Germany
(2) ISO Science Operations Center, Astrophysics Division of ESA,
Villafranca, Spain
The Si or Ge based infrared (IR) detectors of ISOPHOT (Lemke, Klaas at al. 1996) show varying relations between incident flux and measured signal (responsivity) over the orbit of the satellite, triggered by influences like high energy radiation impacts or changing IR-flux. Internal fine calibration sources (FCS) provide a reproducible reference flux, that is absolutely calibrated during the mission by comparison with known celestial standards (stars, planets, asteroids). The FCS signal is then used to determine the detector-responsivity at the time of an observation. The software package presented here was developed in order to support the absolute calibration of the FCSs, which is one of the tasks of the Instrument Dedicated Team (IDT) in the ISO-ground-station in Villafranca near Madrid (Spain).
The software is based on the Interactive Data Language (IDL) (Research Systems Inc., 1992) and the PHT-Interactive Analysis (PIA) (Gabriel et al. 1997), using a simple command line driven interface. The data is processed in units of a single measurement, e.g., data that were taken at a fixed instrument configuration. In this context pointings within a raster are also considered to be single measurements. Detector pixels are taken as independent units and are processed individually. While the standard-way of PIA-processing is followed in general, some improvements were introduced, such as non-interactive empirical drift fitting and quality flagging. Under certain conditions, e.g., when long-term transients are likely to influence a sequence of measurements, the full sequence is corrected together (baseline fit).
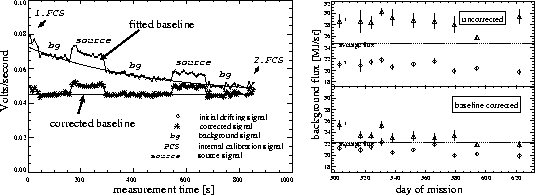
The derived signals are then combined, guided by formatted ASCII-files, that indicate the sequence of the different targets, such as source, background or FCS. The resulting FCS-fluxes are stored in formatted ASCII-tables, allowing for easy examination in editors and step-by-step checking of the intermediate values and are used as database for further research. In addition a PostScript record of signal-diagrams is saved during processing and used in the subsequent analysis and quality checks.
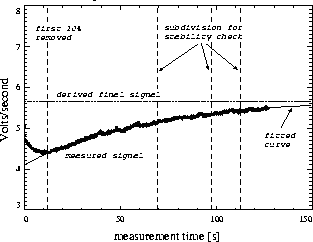
Figure 1 shows a typical detector response after a flux-change,
with a constant flux over the following 128 seconds. The measured signal
is asymptotically drifting towards an upper
limit. This non-ideal detector behaviour is observed in intrinsic
photoconductors operated at low illumination levels.
In order to derive the final signal the first 10% of the data is discarded, thereby avoiding the so called hook-response, which is not described properly by transient models so far (Fouks & Schubert 1995). A statistical trend-check is performed on the remaining portion of the data. In case the dataset is not stable within a confidence limit of 95%, the data is split into two parts and the test is repeated on the latter one, until either the remaining part of the measurement is considered to be stable or one of the following three conditions is met in the next iteration: a) the dataset comprises less than 8 datapoints b) the dataset comprises less than 8 seconds c) the number of iterations exceeds 5. If any of these three conditions is met, the stability test is considered to have failed and an empirical drift fit is tried on the full dataset with the first 10% removed. The measurement is divided into three parts and weighted with the values 0.2, 0.8 and 1 respectively, to improve the fit convergence. Again a quality check using criteria on the curvature is performed on the result. The limits were found empirically and tuned with real data on a trial and error basis. A further check is performed on the final signal deduced from the successful fit. The result is rejected if the average of the last 30% of the measurement is more than a factor of 2 different from the final signal. A final signal is always rejected if negative. In case the fit is not successful, the average of the last 30% of the data is taken as the final signal. The outcome of the various tests, is coded in a two digit quality flag attached to the result.
 |
The development of this software has considerably improved the data quality in the area of ISOPHOT flux calibration, which forms a cornerstone of the overall calibration of the instrument. As long as theoretical transient-models are only available under certain conditions, empirical models provide a useful means to achieve better results. The ASCII-output tables including the quality flags have proved to be a good basis for further analysis of the data, reducing the necessity for checking other datasets from earlier processing levels, in case questions arise. Further improvements, except the ones coming from improved transient-models, are corrections taking into account the actual pointing of the satellite and the beam-profiles.
We thank our colleagues in the PIDT in VILSPA for their valuable suggestions and support.
Kessler, M.F., Steinz, J.A., Anderegg, M.E., et al. 1996, A&A, 315, L27
Lemke, D., Klaas, U., et al. 1996, A&A, 315, L64
Gabriel, C., at al. 1997, in Astronomical Data Analysis Software and Systems VI, ASP Conf. Ser., Vol. 125, eds. Gareth Hunt and H. E. Payne (San Francisco, ASP), 108
Fouks, B., & Schubert, J. 1995, Proc. SPIE 2475, 487
IDL 1992, IDL is a registered Trademark of Research Systems, Inc. ©1992
Next: Reducing SCUBA Data at the James Clerk Maxwell Telescope
Up: Data Analysis Applications
Previous: ASC Coordinate Transformation -- The Pixlib Library, II
Table of Contents -- Index -- PS reprint -- PDF reprint