Next: Analysis Tools for Nebular Emission Lines
Up: Data Analysis Applications
Previous: The Astrometric Properties of the NOAO Mosaic Imager
Table of Contents -- Index -- PS reprint -- PDF reprint
Astronomical Data Analysis Software and Systems VII
ASP Conference Series, Vol. 145, 1998
Editors: R. Albrecht, R. N. Hook and H. A. Bushouse
N. Pirzkal, W. Freudling, R. Thomas and M. Dolensky
Space Telescope - European Coordinating Facility, Karl-Schwarzschild-Str. 2, D-85748 Garching, Germany
Abstract:
A unique capability of NICMOS is its grism mode which permits slitless
spectrometry at low resolution. Extracting spectra from a large number of NICMOS grism images requires a convenient interactive tool which allows a user to manipulate direct/grism image pairs. NICMOSlook and Calnic-C are IDL programs designed for that purpose at the Space Telescope - European Coordinating Facility
. NICMOSlook is a graphical interface driven version of this extraction tool, while Calnic C is a program which performs the same functionality in a ``pipeline`` approach.
Typically, the NICMOS grism mode involves taking a pair of images which includes both a direct image and a grism image. The direct image is used to locate objects of interest, to find the position of the appropriate spectra in the grism image, to determine the optimal extraction technique to use, and to calibrate the wavelength range of the extracted spectra.
NICMOSlook, which has an IDL user interface based on STISlook from Terry Beck, is designed to allow a user to interactively and efficiently extract spectra from a small batch of data. The user maintains full control over the extraction process. NICMOSlook was designed to be most useful to users who want to quickly examine data or fine tune the extraction process. The stand-alone version, Calnic C, is meant to be used on larger sets of data and requires only a minimum amount of user input.
Both programs can be fully configured and extended through the use of a few configuration and calibration files.
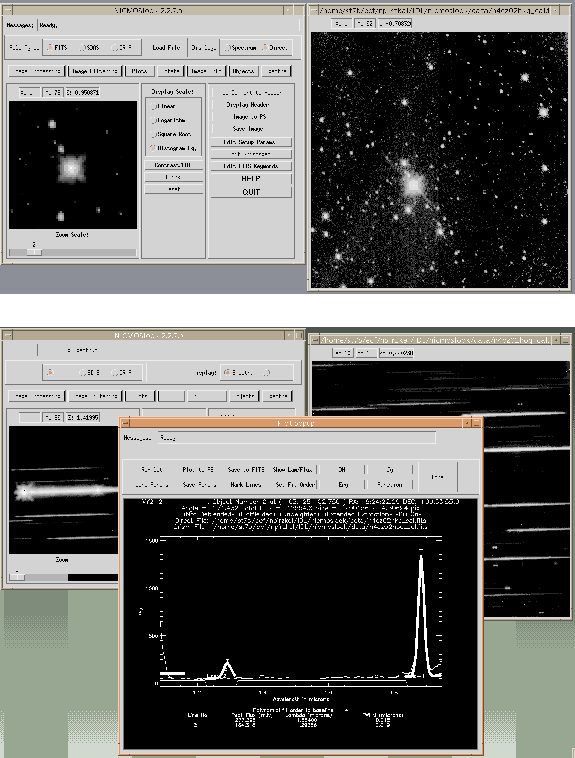
NICMOSlook allows a direct image and corresponding grism images to be read from FITS files and be displayed. A variety of display options are available to the user including a variety of color tables, selectable zoom factors, and the ability to blink the images successively. Some basic image filtering and processing capabilities are also provided to allow the user to locate and identify objects in the direct image (or spectra in the grism image).
In NICMOSlook objects can be identified automatically using the DAOFIND algorithm or can be provided manually by the user (through the use of the cursor or of a text file containing the coordinates of the objects). The spatial extent of objects can also be determined either automatically or through additional user input.
In Calnic C objects in the direct image are located without user input: the location, orientation, and size of each object are determined using SExtractor (Bertin 1996).
Once the position, orientation, and shape of an object have been determined, they are used to infer the position, orientation, and extent of object's spectra in the grism image. This process is completely automatic but it can, nevertheless, be fully customized by the user.
Extracting a spectrum can be done using either weighted or unweighted extractions and using either the Point Source mode (where the cross dispersion spectral profile is taken to be that of a point source), or the Extended Object mode (where the cross dispersion spectral profile is first determined from the shape of the object in the direct image).
Once extracted, the spectrum is wavelength calibrated, and a response function is used to produce a calibrated spectrum in mJy or erg/s/cm2/ as a function of
  .
An attempt can be made to automatically remove the spectral contamination caused by the presence of nearby objects.
The method used uses only the assumption that the shape of the object is not wavelength dependent.
Emission and absorption lines are automatically identified in the resulting spectra. The continuum emission is automatically determined.
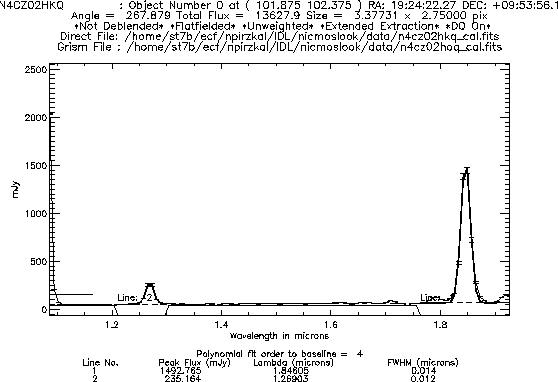
In NICMOSlook the extracted spectrum is plotted on the screen. The user can interactively modify the continuum background fit and examine spectral features. The user can also export the spectrum as a binary FITS table and PostScript plots.
Calnic C outputs a binary FITS table and PostScript plots of each of the extracted spectra.
Figure 1:
The NICMOSlook User Interface
 |
Figure 2:
The paper output of NICMOSlook and Calnic C
 |
NICMOSlook, Calnic C, and their respective User Manuals can be downloaded from
http://ecf.hq.eso.org/nicmos
NICMOSlook and Calnic C require IDL 4.0 or 5.0.
References:
Bertin, E., & Arnouts, S., 1996, A&A, 117, 393
© Copyright 1998 Astronomical Society of the Pacific, 390 Ashton Avenue, San Francisco, California 94112, USA
Next: Analysis Tools for Nebular Emission Lines
Up: Data Analysis Applications
Previous: The Astrometric Properties of the NOAO Mosaic Imager
Table of Contents -- Index -- PS reprint -- PDF reprint
payne@stsci.edu
