


Next: The Structure and Composition
Up: NICMOS Science
Previous: HST/NICMOS Observations of the
Subsections
P. McCarthy, L. Yan,
L. Storrie-Lombardi, and R. J. Weymann
Carnegie Observatories, 813 Santa Barbara St.,
Pasadena, CA, 91101 Email: pmc2@ociw.edu
Abstract:
globular clusters,peanut clusters,bosons,bozos
One of the key results
to come from deep WFPC2 imaging was the realization that galaxies have
very sub-arcsecond angular sizes at
faint apparent magnitudes (e.g. Griffiths et al. 1994).
The small sizes and, consequently high surface brightnesses,
make space-based observations of faint galaxies, even with the
relatively small aperture of HST, equally or more sensitive than similar
observations with large collecting areas on the ground.
The large reduction in background achieved at wavelengths of 0.8 to 1.9 and it's high angular resolution make NICMOS
a very fast imaging device in the broad-band
  and
and  filters. In the minimum
background bandpass, F160W, the on-orbit background is more than 7 magnitudes
fainter than what is typically achieved on the ground.
NICMOS faces two challenges in surveying the population of
faint field galaxies: its small field of view and finite lifetime. Observations
made in parallel with one of the other science instruments offer a means of surveying
significant areas at faint magnitudes while maximizing
the use of the limited on-board cryogen.
The simplest analysis of deep imaging observations is the number magnitude
relation. Galaxy counts as a function of apparent magnitude probe both the
geometry of the Universe and the dynamical and luminosity evolution of
galaxies. Evolutionary effects dominate the departures of the counts from
the Euclidean expectation. The near-IR pass-bands, however, are particularly well suited
to galaxy count studies as they are only mildly sensitive to extinction and
uncertainties in the K-correction.
The deformations of the NICMOS internal optical configuration resulted in poor
images in camera 3 for much of 1997. As a result the parallel observations
that were carried
out before November 1997 were done with cameras 1 and 2. These cameras have small fields
of view and their small pixel sizes lead to significant contributions
from read noise. Teplitz
et al. (1998) and Corbin (these proceedings) describe early results from
examinations of these
data. We have concentrated on the images obtained with Camera 3 after the movement of the
field offset mirror to removed the vignetting associated with distortions
of the optical bench.
With the pupil adjustment mirror set to its extreme position camera 3
now yields images that are
quite close to the performance achieved with a refocusing of the HST secondary mirror.
Each camera 3 image covers 3/4 of one square arc-minute with pixels that are 0.''2 on
a side. The FWHM that we realize from our dithered nominal focus images is 0.''25.
We have reduced the deepest F160W parallel images obtained in the period from November
1997 to January 1998. The approach that we have taken to the processing of the multiaccums
data is independent of the STScI pipeline and relies heavily on McLeod's NICREDv1.5 package
(McLeod 1997). We formed observed sky+dark frames for each read
in the multiaccums sequence by
computing the median of all of the independent high galactic
latitude fields available at that
time. These median sky+dark images were subtracted from each read and each pixel was then
corrected for nonlinearities and cosmic ray events. The individual linearized and cleaned
images were then corrected for the flat field response, block replicated to a
 finer scale, shifted by integer (0.''1) pixel shifts
and combined with a final 3-
 cosmic ray rejection applied. The deepest of our camera 3 parallel images
reaches a
  surface brightness limit of 26 H magnitudes per square arcsecond.
The
  point-source detection limits for our fields range from H = 24.3 to 25.5
We have obtained optical follow-up imaging of several of our fields using the 2.5m
du Pont telescope at the Las Campanas Observatory. The observations were made using a
SITE
 CCD, Johnson V & R filters and a Cousin's I filter. The
pixel scale of the SITE CCD at the Cassegrain focus of the 2.5m is
0.''278. The observations
were made in February of 1998 and the seeing ranged from
0.''6 - 0.''8 FWHM. The
exposure times were typically 6000 seconds in each filter, although one field,
0457-0456 was only observed for 3600 seconds in R. The telescope was offset several tens of
arc seconds between each exposure and standard techniques were used
to calibrate and reduce the images. These images allow us to to determine colors
of objects in the NICMOS images with a factor of 3 range in
wavelength.
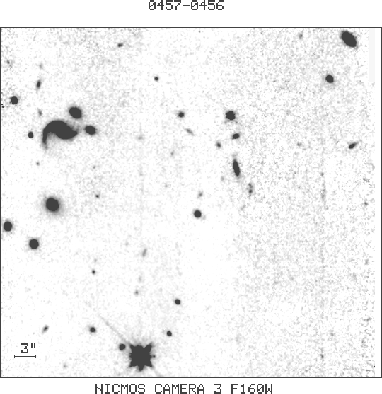
In Figure 1 we show a typical image from the parallel program.
It contains 4500 seconds of
integration in two dither positions and reaches a  surface brightness
limit of H = 25.7.
Our deepest field to date, 1120+1300 is shown in Yan et al. (1998) and
has an additional 0.5 magnitudes of depth. We carried out the object
detection and photometry with SExtractor version 1.2b10b
(Bertin & Arnout 1996) using a photometric zero point for camera3/F160W provided by
M. Rieke (priv. comm). The uncertainty in the zero-point is roughly 5%.
The object detection was performed with
a gaussian kernel with FWHM
= 0.3'' and a 2.0
 detection threshold.
The softer images delivered by camera 3 at the nominal telescope focus actually improve the
reliability of the object detection algorithm and the
photometric precision for small objects, at the cost of some loss of sensitivity.
The isophotal magnitudes were measured to an isophotal level equal to
  above
the global sky noise.
Figure:
A NICMOS Camera 3 F160W parallel field. The field shown is

 |
We define the
total magnitude in a manner similar to those used
by Smail et al. (1995) and Djorgovski et al. (1995).
The philosophy is to measure isophotal magnitudes where possible and to
correct these to 2'' aperture magnitudes using an aperture correction
that is a function of the isophotal magnitude. For the faintest and smallest
objects the isophotal sizes are smaller than the 0.''6 primary
photometry aperture and isophotal magnitudes are subject
to large uncertainties. For these objects we apply an aperture correction to
convert the 0.''6 magnitudes to a 2'' aperture. The magnitude
of this correction was determined from the average profile of 20 faint galaxies
and was found to be indistinguishable from that derived from stars with H .
The details of the aperture correction for galaxies with isophotal
sizes larger than 0.''6
are given in Yan et al. (1998).
The principal sources of systematic error in deriving galaxy number counts are
the aperture correction and the incompleteness and false detection corrections.
The aperture corrections, described above, where chosen to be robust in the face of
low signal-to-noise ratio and under-sampled data. More sophisticate approaches are
possible (e.g. Petrosian 1998) but generally require high quality data. The completeness
determination, however, must be tailored to the specific data set. In our data we
suffer from low spatial frequency errors in the dark+bias corrections that impact the
detection efficiency locally. This source of uncertainty operates in addition to the
effects of crowding and Poisson noise.
Yan et al. (1998) carried out an extensive series of simulations to quantify
the incompleteness effects. We adopt a 50% completeness level as our cutoff
and the simulations show that this corresponds to depths of H= 23.8 to 24.8 for our
chosen fields. As described in Yan et al. the rate of false detections
is of the order of 5%.
Figure 2:
Raw and corrected galaxy counts. The raw counts are
shown as open symbols, the corrected counts as filled. The error bars
are derived from the variance within each bin averaged over all fields.
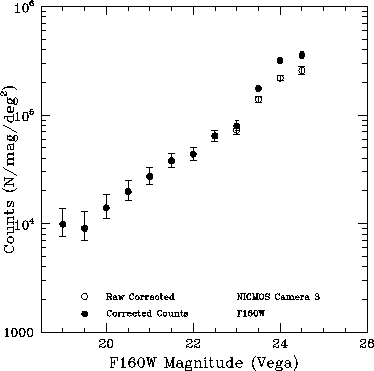 |
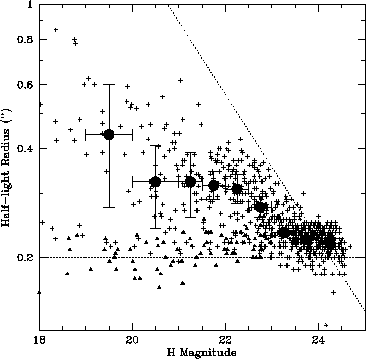
Figure 3:
The derived half-light radii for all of the detected objects in
12 high latitude fields, plotted as crosses. The median sizes are plotted with
heavy filled symbols, the locus of stellar points are shown as filled triangles.
 |
In Figure 2 we plot our raw and corrected galaxy counts. The error bars represent
the statistical uncertainty in each magnitude bin, averaged over all the fields
that contribute to that bin. The slope of the differential counts is
 .
This
slope is quite close to the observed slope in the K-band counts for K> 18
(Gardner et al. 1993; Djorgovski et al. 1995; Moustakas et al. 1997).
We characterize the size of the detected objects in terms of their half-light radii.
The image of each object was extracted
and regrided with  finer sampling. The enclosed flux was
then computed in half pixel steps until 50% of the total flux was enclosed,
the total flux being derived from the total magnitude as described above.
We used the same algorithm as that used by Smail et al. (1995).
In Figure 3 we plot the derived half-light radii for all of the objects detected
in 12 high galactic latitude fields. We also plot the median size in one or half magnitude
bins. The filled triangles are the results of the same analysis applied to a
globular cluster field over the magnitude range
16 < H < 23.
Because the near-IR counts are, in comparison to the visible-band counts, less
sensitive to uncertainties in the K- and evolutionary corrections they have attracted
considerable attention in recent years. There have been suggestions that the K-band
counts can be used to discriminate between various world models (e.g. large or small
qo, zero or non-zero  )
as well as some well considered cautions to
such goals (e.g. Djorgovski et al. 1995). Nevertheless, it is fair to say that until
recently no clear evidence of departure from non-evolving models had been seen in the
K-band counts (e.g. Metcalf et al. 1995).
Recently Bershady et al. (1998) presented evidence for significant
excesses over the Gronwall & Koo (1995) no evolution models for K magnitudes
fainter than
  .
.
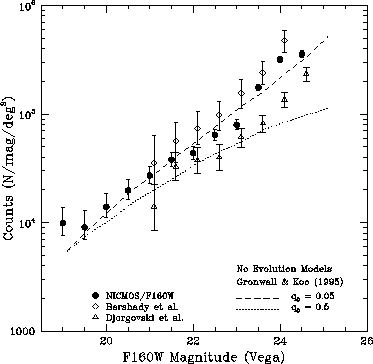
Figure 4:
NICMOS F160W counts compared to Keck K counts and models. The
K-band counts are from Bershady et al. and Djorgovski et al. and have been transformed to F160W
by applying F160W = K + 1.1. The curves are non-evolving models from Gronwall
& Koo (1995) transformed to F160W as above.
 |
We would like to be able to directly compare our F160W counts to those observed
at K. To do this we use the transformation given by Gardner (1998). In the magnitude
range of interest this transformation is well approximated by a simple offset of
1.1 magnitudes. In Figure 4 we plot our counts along with those of Bershady et al.
(1998), Djorgovski et al. (1995),
and the Gronwall & Koo (1995) models, with the latter data sets transformed
to F160W as described above. Our counts fall midway between the Bershady et al. and
Djorgovski et al. counts.
The counts shown in Figure 4 show a departure from the low density
zero  no-evolution model of Gronwall & Koo. Averaging our
counts with Bershady's yields a factor of 2 excess over no evolution at
H= 24. The run of half-light radii versus magnitude displayed
in Figure 3 shows that this excess of counts is dominated by objects with angular
sizes
< 0.''25. As our detection efficiency at faint magnitudes is clearly impacted
by our surface brightness limits, our number counts at these magnitudes should be
treated as lower limits. Like Bershady et al.'s K-band counts, our F160W counts are
systematically higher than the counts reported by Djorgovski et al. (1995), after
allowing for the transformation from K to F160W. Bershady et al. attribute this discrepancy
to differing approaches to the aperture corrections. Our methodology in deriving and
applying the aperture corrections is very similar to that used by Djorgovski et al.,
the primary difference being that our primary measurement aperture size, 0.''6 is
larger, in terms of the instrumental response FWHM, than that used by Djorgovski et al..
The differences in the various counts may reflect field-to-field
variations rather than differences in the photometry.
In all but the last magnitude bin (
24.25 < H < 24.75) our
measurements cover an area
  larger than that covered in either the
Bershady et al. or Djorgovski et al. studies. The slopes derived from all three programs
are in close agreement.
Near-IR images of high latitude fields by a number of groups have revealed
a population of objects with colors that are as red or redder than evolved
extinction-free stellar populations at plausible redshifts (e.g. McCarthy, Persson,
& West 1992; Hu & Ridgway 1994 etc.). These Extremely Red Objects (EROs)
begin to appear at
K magnitudes of approximately 17 (see Ellis 1997, Figure 5b)
and are usually defined by R - K > 6, although
some authors use a more strict criterion. The nature of these objects remains unclear
at this time. Hu & Ridgway argued that they were  L* ellipticals at
 on the basis of their spectral energy distributions. Graham & Dey (1996)
obtained a redshift for one of the red Hu & Ridgway objects and argued that it was
a dusty star-forming object. The recent sub-mm detection of this object by Cimatti et al.
(1998) strongly supports the starburst model for this particular object.
NICMOS offers the potential for high resolution imaging
of such objects. The difficulty is that in the absence of pointed observations one
must cover substantial area to detect such objects. Our ground-based visible-light imaging
of the NICMOS parallel fields has revealed one such object and a small number of
similar objects are within the camera 2 or camera 3 images of distant radio galaxies
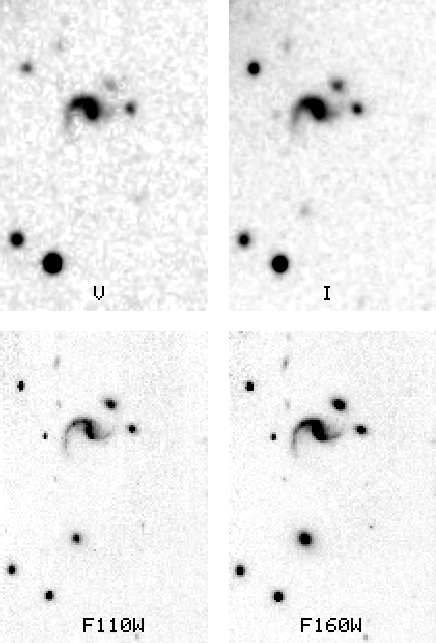
and quasars. In Figure 5 we show a set of 4 images of a sub-portion of the field
shown in Figure 1. The ERO is clearly visible and is well resolved. With an H-band
magnitude of 18.8 it is well detected and its morphology is fairly concentrated,
in contrast to the distorted morphology reported for HR10 by Graham & Dey. The
spectral energy distribution of this object can be fit with a dust-free galaxy
model, but it requires both a large redshift and age. Similar objects in the
radio galaxy fields can be fit with less extreme models and these may well represent
a population of z > 1 ellipticals with old stellar populations.
Figure:
V,I, F110W, & F160W images of a portion of the field
shown in Figure 1. Each image is
 in size. The
very red object near the center has H = 18.8.
 |
We have analyzed a modest fraction of the NICMOS camera 3 imaging parallels.
These data offer a unique combination of depth and resolution at wavelengths that
were heretofore unavailable from space. These low-cost low-impact images already
probe as deep or deeper than the deepest K-band images obtained with large apertures
on the ground. We have shown that the galaxy counts continue with a slope of 0.31
to H and that there is a likely excess of counts above non-evolving models.
This excess is dominated by objects with small angular sizes. Ground-based followup
imaging has revealed a number of extremely red objects and has provided our
first high-resolution images of the ERO population at wavelengths beyond
1
 .
.
We thank the staff of the Space Telescope Science Institute,
and J. Mackenty in particular, for
their efforts in making this parallel program possible.
We acknowledge useful discussions with J. Gardner, H. Teplitz,
R. Thompson, & M. Rieke. B. McLeod and I. Smail are thanked for generously
allowing the use of their software for the data reduction and scale length
measurements. This research was supported, in part, by grants
from the Space Telescope Science Institute, GO-7498.01-96A and
P423101.


Next: The Structure and Composition
Up: NICMOS Science
Previous: HST/NICMOS Observations of the
Norbert Pirzkal
1998-07-09
![]() depths of H
= 24.3 - 25.5. We derive the galaxy number counts in an area of
roughly 9 square arc-minutes. The slope of the counts fainter than
H = 20 is 0.31, and the
integrated surface density to H
depths of H
= 24.3 - 25.5. We derive the galaxy number counts in an area of
roughly 9 square arc-minutes. The slope of the counts fainter than
H = 20 is 0.31, and the
integrated surface density to H
![]() is
is
![]() galaxies per
square degree. We transform the deepest K-band counts to our system and find
good agreement. At H = 24.5 the observed surface density is roughly twice
that predicted by non-evolving models. The half-light radii
of the galaxies declines steeply
with apparent magnitude and reaches our resolution limit of
galaxies per
square degree. We transform the deepest K-band counts to our system and find
good agreement. At H = 24.5 the observed surface density is roughly twice
that predicted by non-evolving models. The half-light radii
of the galaxies declines steeply
with apparent magnitude and reaches our resolution limit of
![]() at H = 23.5. Deep ground-based VRI imaging of one NICMOS field has revealed a very
red galaxy with H = 18.8 and R - H = 6.
at H = 23.5. Deep ground-based VRI imaging of one NICMOS field has revealed a very
red galaxy with H = 18.8 and R - H = 6.


