A. Aloisi Dipartimento di Astronomia, Università di Bologna, Bologna, I 40126, E-mail: aloisi@astbo3.bo.astro.it
L. Origlia and M. Tosi Osservatorio Astronomico di Bologna, Bologna, I 40126
L. Greggio1 Dipartimento di Astronomia, Università di Bologna, Bologna, I 40126
M. Clampin, C. Leitherer and A. Nota2 Space Telescope Science Institute, Baltimore, MD 21218
M. Sirianni Dipartimento di Astronomia, Università di Padova, Padova, I 40100
(1)Universitaets Sternwarte Muenchen, Muenchen, D 81679 (2)Affiliated with the Astrophysics Division, Space Science Department of the European Space Agency
infrared: stars - stars: HR and CM diagrams - galaxies: evolution - galaxies: individual: NGC 1569 - galaxies: starburst - galaxies: stellar content
Dwarf irregular galaxies (DIGs) and blue compact dwarf galaxies (BCDGs)
are of crucial importance to understand galaxy formation and evolution.
They are fundamental ingredients in common scenarios of galaxy formation,
either as left-overs or as building blocks of the formation process
(Silk 1987). They have also been suggested to be the equivalent at early
epochs (z![]() 1) of the faint blue galaxies responsible for the count
excess seen in deep photometric surveys.
Nearby galaxies of this type are ideal laboratories for such studies because
their proximity allows us to examine in detail issues which are important
to interpret the galaxy behavior with time, and therefore with redshift;
among these the occurrence of galactic winds, the chemical enrichment of
the interstellar medium and intergalactic medium, the photometric evolution.
Besides, their low level of evolution, as indicated by the low metallicity
and the high gas content, makes these systems the most similar to primeval
galaxies, and thus the most useful to infer the primordial galaxy conditions
and Big-Bang nucleosynthesis products. Understanding how the star formation
(SF) proceeds in blue compacts and irregulars is then fundamental for
astrophysical and cosmological purposes.
1) of the faint blue galaxies responsible for the count
excess seen in deep photometric surveys.
Nearby galaxies of this type are ideal laboratories for such studies because
their proximity allows us to examine in detail issues which are important
to interpret the galaxy behavior with time, and therefore with redshift;
among these the occurrence of galactic winds, the chemical enrichment of
the interstellar medium and intergalactic medium, the photometric evolution.
Besides, their low level of evolution, as indicated by the low metallicity
and the high gas content, makes these systems the most similar to primeval
galaxies, and thus the most useful to infer the primordial galaxy conditions
and Big-Bang nucleosynthesis products. Understanding how the star formation
(SF) proceeds in blue compacts and irregulars is then fundamental for
astrophysical and cosmological purposes.
A quantitative comparison between observations and chemical evolution
models has evidenced that the SF in blue compacts proceeds in few short
and intense bursts (e.g. Matteucci & Tosi 1985, Marconi et al. 1994). The
analysis of the color-magnitude diagrams (CMDs)
of dwarf irregulars in the Local Group indicates a SF
activity in the last ![]() 0.5 Gyr occurred in long episodes separated by
long quiescent intervals (e.g. Tosi 1994, Greggio 1995). On the other hand
the analysis of the integrated light from giant irregulars is consistent with
continuous, even constant SFR (Hunter & Gallagher 1985, 1986). All these
evidences are consistent with the theory of Stochastic Self Propagating Star
Formation (Gerola et al. 1980): the star formation level is directly related
to the dimensions of the systems, the smallest ones having the longest
quiescent phases and the shortest bursts of SF. Anyway, the question is
still far from being settled and requires further studies of relatively
nearby systems where it is possible to resolve single stars and study the
stellar content with the required accuracy.
0.5 Gyr occurred in long episodes separated by
long quiescent intervals (e.g. Tosi 1994, Greggio 1995). On the other hand
the analysis of the integrated light from giant irregulars is consistent with
continuous, even constant SFR (Hunter & Gallagher 1985, 1986). All these
evidences are consistent with the theory of Stochastic Self Propagating Star
Formation (Gerola et al. 1980): the star formation level is directly related
to the dimensions of the systems, the smallest ones having the longest
quiescent phases and the shortest bursts of SF. Anyway, the question is
still far from being settled and requires further studies of relatively
nearby systems where it is possible to resolve single stars and study the
stellar content with the required accuracy.
A crucial point to understand galaxy evolution is thus to check whether or not all the dwarf starburst galaxies contain an old stellar population, besides the youngest one, and trace back to early epochs the history of star formation. The best way to search for old stellar populations is to observe the resolvable galaxies in the infrared and construct the corresponding CMDs, where the old low mass stars on the red giant branch evolutionary phase are more easily visible and distinguishable from the younger, more massive objects.
In order to evaluate the contribution of blue compact dwarf galaxies to the galaxy counts at high redshift it is necessary to know their SF history in a wide range of epochs. Systems which show high values of SFRs, as the so-called Blue Compacts and Starbursting Dwarfs, should be the main contributors to galaxy counts at high redshift and NGC 1569 is the closest system of this type.
NGC 1569 is a blue dwarf irregular located at a distance of 2.2 Mpc,
corresponding to a distance modulus (m-M)0=26.71. Its total mass and
hydrogen content are M
![]() 3.3
3.3
![]() 108 M
108 M![]() and MH
and MH
![]() 1.3
1.3
![]() 108 M
108 M![]() respectively (Israel
1988). The average metallicity is Z
respectively (Israel
1988). The average metallicity is Z
![]() 0.25 Z
0.25 Z![]() .
We are then
dealing with a gas-rich system in a relatively early stage of its chemical
evolution. Furthermore, the intrinsic blue colors and the H
.
We are then
dealing with a gas-rich system in a relatively early stage of its chemical
evolution. Furthermore, the intrinsic blue colors and the H![]() morphology,
showing many filaments and arc-like structures, indicate that this galaxy is
experiencing an intense SF process and related galactic winds.
morphology,
showing many filaments and arc-like structures, indicate that this galaxy is
experiencing an intense SF process and related galactic winds.
Pre-Costar HST studies of the field population of NGC 1569 were done by
O'Connell et al (1994) and Vallenari & Bomans (1996). These data have shown
that the galaxy contains two so-called Super Star Clusters (SSCs), i.e.
unresolved stellar systems suggested to be similar to globular clusters
but of very young ages (a few Myr). With their observed I,(V-I) CMD
Vallenari & Bomans reached a magnitude I![]() 22.5, sampling a look-back
time of
22.5, sampling a look-back
time of ![]() 1.5 Gyr. Using the interpretative methods of isochrones and
synthetic CMDs, they demonstrated that the galaxy has experienced a global
burst of SF from 0.1 Gyr to 4 Myr ago. They found also some evidences of an
older episode from 1.5 Gyr to 0.15 Gyr with a significantly lower SFR.
1.5 Gyr. Using the interpretative methods of isochrones and
synthetic CMDs, they demonstrated that the galaxy has experienced a global
burst of SF from 0.1 Gyr to 4 Myr ago. They found also some evidences of an
older episode from 1.5 Gyr to 0.15 Gyr with a significantly lower SFR.
NGC 1569 was observed by our group with the WFPC2 on board HST on January
1996 (De Marchi et al. 1997, Greggio et al. 1998). Deep images were taken
in the F555W and F439W broadband filters, while less deep frames in the
F380W filter (corresponding indicatively to the standard ground-based V,B,U
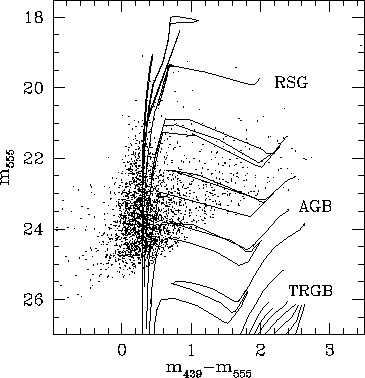
bands). The photometric reduction produced the V, (B-V) CMD plotted in
Figure 1 for all objects with a photometric error ![]() 0.2
in both bands (
0.2
in both bands (![]() 2800 stars).
2800 stars).
 |
At the distance of 2.2 Mpc the optical data in the B and V filters
sample only stars as young as 0.15 Gyr (V,B<26). The theoretical
interpretation of this observed CMD with the method of synthetic diagrams
has indicated a SF in the field stopped around 8 Myr ago, but rather
continuous over the whole look-back time sampled (with quiescent periods no
longer than 10 Myr) and 103 times higher than in the solar neighbourhood
(Greggio et al. 1998). Thus in every respect this system has been a
starburst galaxy with one of the highest estimated SFRs (4![]() 20 M
20 M![]() yr-1 kpc-2).
yr-1 kpc-2).
The optical V, B-V CMD allows us to reconstruct the SF history of NGC 1569 only over the last 0.15 Gyr, giving an indication of a high SFR in this look-back time. The high SFR, the relatively low abundances measured and the high gas content revealed for this object seem to suggest that this galaxy is experiencing a strong SF activity just in recent epochs: its previous SFR should have been at a much lower level.
In their I vs (V-I) diagram sampling a look-back time of 1.5 Gyr, Vallenari & Bomans (1996) detected a well populated AGB, which indicates a previous episode of SF in NGC 1569 at intermediate ages (see their Figure 5), even if with a very low SFR. Recent measurements of the oxygen, nitrogen and helium abundances in the ISM of NGC 1569 (Kobulnicky & Skillman 1997), when compared to predictions of chemical evolution models for bursting dwarfs (Marconi et al. 1994), seem consistent with several bursts of SF, provided that strong galactic winds have occurred to loose part of the products of stellar nucleosynthesis. Considerations on the short gas exhaustion timescales suggest that these previous bursts cannot be as strong as the last one.
In Figure 1 superimposed on the observational optical data are
the theoretical stellar evolution tracks from 0.6 to 120 M![]() at
Z=0.004 (Fagotto et al. 1994). Due to the instrumental limits, the optical
data allow one to analyse in great detail the blue (young) stars and only the
more massive red ones. This implies that with the V, (B-V) diagram we are
just able to sample the red supergiants (RSGs) but barely reach the asymptotic
giant branch (AGB) stars. Even using the I, (V-I) diagram we can at best reach
the brightest portion of the AGB (Vallenari & Bomans 1996).
at
Z=0.004 (Fagotto et al. 1994). Due to the instrumental limits, the optical
data allow one to analyse in great detail the blue (young) stars and only the
more massive red ones. This implies that with the V, (B-V) diagram we are
just able to sample the red supergiants (RSGs) but barely reach the asymptotic
giant branch (AGB) stars. Even using the I, (V-I) diagram we can at best reach
the brightest portion of the AGB (Vallenari & Bomans 1996).
In contrast, NIR CMDs are the best instrument to study properly not only the
brightest red stellar populations (RSGs, AGB) in the age range from a few Myr
to 1 Gyr, but also the red giant branch (RGB) stars with ages from 1 to 15 Gyr:
since the RGB tip is predicted by all stellar evolution theories to be
located at a constant luminosity log(L/L![]() )=3.4, the detection of
objects in this phase would without doubts show the existence of stars in the
mass range 0.6-2 M
)=3.4, the detection of
objects in this phase would without doubts show the existence of stars in the
mass range 0.6-2 M![]() ,
while the RGB tip color distribution will give
us the epochs of major SF episodes over a Hubble time. The absence of stars
at the RGB tip will definitely show that the parent galaxy has been
forming stars only in epochs more recent than 1 Gyr.
,
while the RGB tip color distribution will give
us the epochs of major SF episodes over a Hubble time. The absence of stars
at the RGB tip will definitely show that the parent galaxy has been
forming stars only in epochs more recent than 1 Gyr.
We observed the field around the two SSCs of NGC 1569 with the NICMOS
infrared detector in February 1998. Ten different frames with a spiral
pattern dithering and a MULTIACCUM readout mode in the two F110W and
F160W broadband filters (roughly J and H bands) were taken on NIC2
camera for a 19
![]() 19
19
![]() field of
view, a resolution of 0
field of
view, a resolution of 0
![]() .075 per pixel and a total
integration time of
.075 per pixel and a total
integration time of ![]() 5,100 s in each filter (4 orbits in total).
The RGB tip in NGC 1569 is expected at J
5,100 s in each filter (4 orbits in total).
The RGB tip in NGC 1569 is expected at J![]() 23, as inferred from
its position at V
23, as inferred from
its position at V![]() 26 in our optical diagram of Figure 1
and from the typical color of red giants (V-J
26 in our optical diagram of Figure 1
and from the typical color of red giants (V-J![]() 3). With the exposure
times used NIC2 should be able to reach J,H=24
3). With the exposure
times used NIC2 should be able to reach J,H=24![]() 25 with a S/N
25 with a S/N![]() 10
and allow us to perform photometry 1
10
and allow us to perform photometry 1![]() 2 mag below the RGB tip.
2 mag below the RGB tip.
All frames were calibrated through the standard STScI pipeline which for dithered images makes use of the two different stages CALNICA (for instrumental calibration and cosmic ray rejection on each single frame) and CALNICB (for the reconstruction of the mosaic). The photometric reduction was performed using the PSF-fitting DAOPHOT package on a 2 pixel aperture: all parameters involved were set at the values deduced from the HST Data Handbook (see Voit 1997 for more details) and from a statistical analysis of images. Instrumental magnitudes were then converted into the HST VEGAMAG system following the prescription of the Handbook.
The crowding of the infrared field and the difficulty in finding isolated stars to construct a good PSF brought us to try the simulation of theoretical PSFs with the Tiny Tim software (Krist & Hook 1997), but we encountered some difficulties in generating polychromatic PSFs. We thus searched for datasets of some calibration programs in order to build a template PSF in each filter for the reduction of our frames.
 |
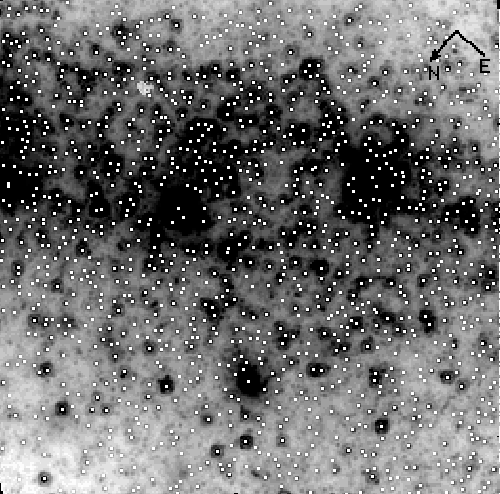
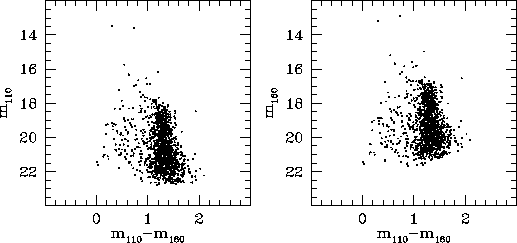
Figure 2 shows the mosaicked image in the F160W band with
sumperimposed the coordinates of all stars fitted in both bands and
plotted in the infrared CMDs of Figure 3 (a total of ![]() 1330
objects). These diagrams show few main sequence stars around (J-H)
1330
objects). These diagrams show few main sequence stars around (J-H)![]() 0
and a large number of post-main sequence red stars.
0
and a large number of post-main sequence red stars.
 |
From a rapid analysis of our NIR CMDs it is immediately clear that
however we choose the values of the parameters involved in the procedure
of photometric reduction, we are not able to reach the predicted magnitude
limits in J,H of 24![]() 25: we remain 2
25: we remain 2![]() 3 mag brighter and
3 mag brighter and ![]() 1
mag above the RGB tip. An inspection of the position of stars fitted in the
F160W image of Figure 2 indicates that the stars measured are only
the brightest objects; there are fainter objects which appear resolved by eye
but the standard photometric reduction seems unable to recognize and fit them.
1
mag above the RGB tip. An inspection of the position of stars fitted in the
F160W image of Figure 2 indicates that the stars measured are only
the brightest objects; there are fainter objects which appear resolved by eye
but the standard photometric reduction seems unable to recognize and fit them.
The problem is not attributable to the estimate of the necessary exposure time. It could be instead that NICMOS performances have been somehow overestimated or that the instrumental calibration and frame combination of the associated images in the standard pipeline have not been appropriate. The complex procedures used yield also to a difficult estimate of parameters (as gain and readout noise) involved in the photometric reduction of the final mosaicked images. As these parameters are of primary importance in the detection of stars above a certain threshold and in the estimate of photometric errors and fit goodness, an erroneous value can lead to an incorrect result and to the difficulty in finding, fitting and retaining faint stars. This difficulty in fitting faint stars seems not due to the PSF used, as we tried with two different solutions: a PSF constructed with three quite isolated stars in our frames and a template obtained from the calibration program frames. On the other hand, we should also consider the extreme crowding of our central regions, which requires a very fine tuning of all the reduction parameters to resolve the fainter stars.
The CMDs in Figure 3 represent at the moment the best result we
are able to obtain with the standard calibration pipeline and photometric
reduction. They are clearly insufficient to reach the RGB tip at J![]() 23.
At this preliminary stage, we can conclude that non standard procedures
for the data reduction appear to be necessary (and hopefully sufficient) to
reach our scientific goal.
23.
At this preliminary stage, we can conclude that non standard procedures
for the data reduction appear to be necessary (and hopefully sufficient) to
reach our scientific goal.
A.A. thanks the organizing committee of this workshop for the financial support.
