Marc Balcells Instituto de Astrofísica de Canarias, Via Lactea, s/n, 38200 La Laguna, Tenerife, Spain. E-mail: balcells@ll.iac.es
Bulges of spiral galaxies are generally seen as small elliptical galaxies in
the center of a large spiral. For example, bulges fall on the fundamental
plane of elliptical galaxies (Djorgovski & Davies 1987, Bender et al. 1992).
Dynamically, bulges are hotter than disks, while colder than giant ellipticals.
Their surface brightness profiles fall off as
![]() (Andredakis et al. 1995), with n getting smaller towards later morphological
types.
In a series of papers (Balcells & Peletier 1994, Peletier & Balcells 1996,
1997) we have studied the stellar populations of bulges by taking a sample
of highly inclined early-type spirals (type S0-Sbc), and analyzing optical and
near-infrared colors of the side of the minor axis which is not obscured by the
disk. This method avoids the need to address extinction corrections,
which are very uncertain in inclined galaxies. That our minor axis
color profiles are smooth suggests that dust effects are indeed minimal.
(Andredakis et al. 1995), with n getting smaller towards later morphological
types.
In a series of papers (Balcells & Peletier 1994, Peletier & Balcells 1996,
1997) we have studied the stellar populations of bulges by taking a sample
of highly inclined early-type spirals (type S0-Sbc), and analyzing optical and
near-infrared colors of the side of the minor axis which is not obscured by the
disk. This method avoids the need to address extinction corrections,
which are very uncertain in inclined galaxies. That our minor axis
color profiles are smooth suggests that dust effects are indeed minimal.
We found that dustfree colors of bulges are never redder than ellipticals of the same luminosity. This implies that their metallicities are lower than those of giant ellipticals. In addition we found that the colors of bulges are very similar to those of the inner disk, both for blue optical and for optical-infrared colors. Color differences from galaxy to galaxy are much larger than the differences between bulge and disk of the same galaxy. This implies that the inner disk (at 2 scale lengths) must have formed at most 3 Gyr after the bulge.
HST allows us to investigate the centers of bulges with a ten fold increase in spatial resolution. HST-based information on the colors of galaxy centers at scales of tens of parsecs is scarce. Colors contain useful information on the stellar populations of the galaxy centers. They also give clues about the amount of internal extinction due to dust. For ellipticals, unsharp masking techniques show that patchy dust is very common (van Dokkum & Franx 1995). Dust may affect the shapes of surface brightness profiles observed by eg. Lauer et al. (1995).
Here we show first results of a color study of the centers of galactic bulges. Since we are interested in disentangling the effects of extinction, metallicity and age, we have chosen to observe a sample of galaxies in 3 bands covering a large wavelength baseline. We observed in the NICMOS F160W band (H-band), F814W (I) and in F450W, a wider version of the B-band. With these three bands we can make the red I-H color, primarily sensitive to extinction by dust and old stellar population gradients, and the B-I color, especially sensitive to recent star formation. Examples of how these colors can be used are shown in e.g. Knapen et al. (1995). This is the first study of colors of early-type galaxies based on NICMOS data. In a following paper, the surface brightness profiles are presented in H, I and B, showing the effects of dust on the surface brightness profiles of bulges.
20 galaxies were observed with HST in Cycle 7 (Summer 1997) with WFPC2
(F450W and F814W) and NICMOS (F160W). They all are part of the
original sample of Balcells & Peletier (1994), which is a complete,
magnitude-limited sample in B of early-type spirals (type S0-Sbc)
with inclinations larger than 50![]() .
The galaxies observed with HST
are all objects for which one side of the minor axis is more or less
featureless as seen from the ground. We assume that this means that extinction
by dust there is negligible (in general less than AB = 0.05 mag).
The subsample was chosen to include galaxies from all types S0-Sbc,
excluding galaxies that are exactly edge-on, and is biased towards the
nearest objects.
.
The galaxies observed with HST
are all objects for which one side of the minor axis is more or less
featureless as seen from the ground. We assume that this means that extinction
by dust there is negligible (in general less than AB = 0.05 mag).
The subsample was chosen to include galaxies from all types S0-Sbc,
excluding galaxies that are exactly edge-on, and is biased towards the
nearest objects.
To reduce the optical data the normal HST-pipeline reduction was used.
For NGC 7457 the I-band observations were taken from the HST Archive.
For the H-band two MULTIACCUM NIC2-exposures of in total 256 s were taken,
offset from each other by 1''. The normal STSDAS CALNICA reduction package was
used, after which a small fraction of the flatfield was subtracted from the
reduced images, to account for a non-zero pedestal level in the raw image.
This fraction was determined by requiring that the final image was smooth.
Applying this step is only important for the lowest flux levels, but it improves
the image considerably.
The final sky background level was determined by comparing the image with
the ground-based image in the same band. For the H-band a small correction
was applied to the K-band image (a fit to Worthey (1994)'s models):
 |
The images were calibrated to the STMAG system using Holtzmann et al. (1995),
using a constant shift of 0.10 mag to correct to infinite aperture. After this,
the same paper was used to iteratively account for the color term in
the F450W filter. The colors were corrected for galactic extinction
using the new dust maps of Schlegel et al. (1998), and the Galactic extinction
law (Rieke & Lebofsky 1985). After this the bands were redshift-corrected. This small correction
(from Persson et al. 1979) was ![]() = -5z,
= -5z, ![]() = -z and
= -z and
![]() = 0.
= 0.
To account for the difference in Point Spread Functions (PSF) when determining
the X - Y color profile, the X-band image was convolved with the
Y-band PSF, and the Y-band image with the X-band PSF. These PSFs
were determined with the Tiny Tim package (Krist 1992).
We then determined minor axis profiles in wedges of 22.5![]() ,
centered on the H-band nucleus, and subtracted these wedges to get color
profiles. Finally the color profiles were combined with the ground-based
color profiles, to cover the whole range of the bulge, shifting the
ground-based profile on top of the HST-profile. In this way absolute and relative
accuracies of a few percent can be expected (Colina 1998). Real-color images
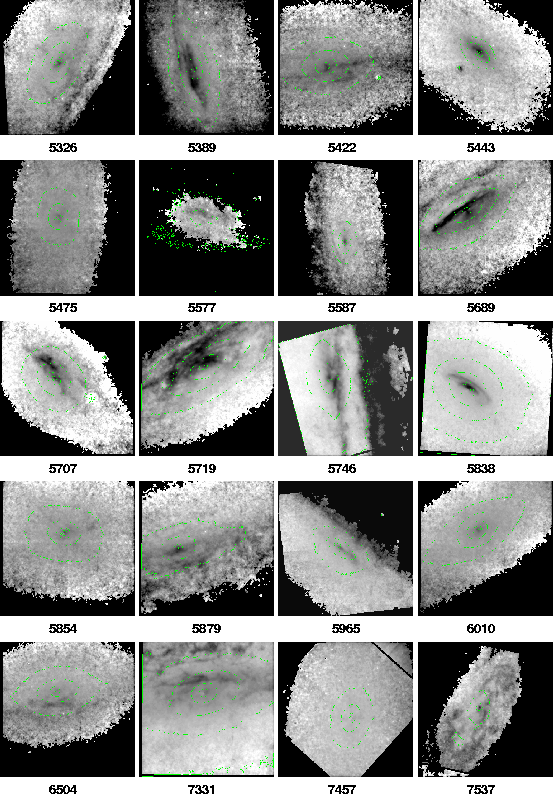
of the galaxies are shown in Fig. 1.
,
centered on the H-band nucleus, and subtracted these wedges to get color
profiles. Finally the color profiles were combined with the ground-based
color profiles, to cover the whole range of the bulge, shifting the
ground-based profile on top of the HST-profile. In this way absolute and relative
accuracies of a few percent can be expected (Colina 1998). Real-color images
of the galaxies are shown in Fig. 1.
In Fig. 2 we show the I-H color maps of the 20 galaxies,
superimposed on the H-band contour maps. The maps indicate the
position of dustlanes. Comparing these images with those of Fig. 1 it is
clear that many, maybe all, galaxies have red nuclei. We now try to estimate how
much extinction they contain.
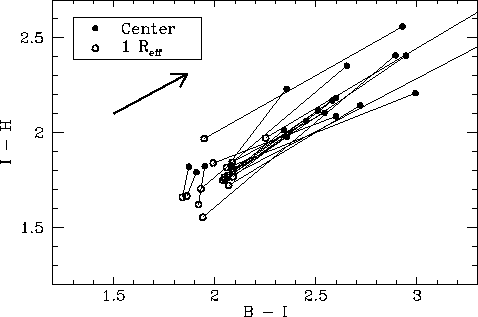
In Fig. 3 we show the colors at the
center and at one bulge effective radius in a B-I vs. I-H
color-color diagram. The Figure shows indeed that in all cases the center is
redder, by sometimes very large amounts. Since the vector indicating
reddening by dust is almost parallel to the the vector indicating changes
in metallicity (see Fig. 4), it is not possible to say exactly how
much of the reddening is due to extinction. Lower and upper limits
to the internal extinction may be estimated as follows.
 |
We see in Fig. 3 that three blue galaxies in the bottom left corner
of the diagram show small color differences. These are NGC 7457, NGC 5854 and
NGC 5577. NGC 5577 is an Sbc galaxy with much lower surface brightness than
the rest of the galaxies, with patches of dust and star formation everywhere
in its central areas, clearly different from most
other galaxies in the sample. For the other two galaxies, both semi-minor axis
color profiles are
smooth. A plausible upper limit to the reddening is derived by
taking these profiles to be representative of the population-induced
color gradients in our sample;
assuming that the colors at one effective radius are dustfree,
one obtains that the central I-H
colors are reddened by on the average 0.29 ![]() 0.05 mag, and the B-I
colors by 0.58
0.05 mag, and the B-I
colors by 0.58 ![]() 0.10 mag.
A lower limit to the reddening
can be found if one assumes that the stellar
populations are never redder than those of the central Virgo galaxy NGC 4472.
Studies by e.g. Balcells & Peletier (1994) have shown that dustfree bulge
colors at r
0.10 mag.
A lower limit to the reddening
can be found if one assumes that the stellar
populations are never redder than those of the central Virgo galaxy NGC 4472.
Studies by e.g. Balcells & Peletier (1994) have shown that dustfree bulge
colors at r![]() /2 are never redder than ellipticals of the same size,
making this assumption very likely. Using here B-I = 2.30
and I-H = 1.85, we find that in this case the I-H colors would be
reddened by on the average 0.37
/2 are never redder than ellipticals of the same size,
making this assumption very likely. Using here B-I = 2.30
and I-H = 1.85, we find that in this case the I-H colors would be
reddened by on the average 0.37 ![]() 0.06 mag and B-I by 0.44
0.06 mag and B-I by 0.44 ![]() 0.10 mag.
Using the Galactic extinction law
(Rieke & Lebofsky 1985) these numbers correspond to an average internal
extinction AV
between 0.69 and 0.89 mag, if I-H is used, and between 0.60 and 0.80 mag
when one uses B-I.
0.10 mag.
Using the Galactic extinction law
(Rieke & Lebofsky 1985) these numbers correspond to an average internal
extinction AV
between 0.69 and 0.89 mag, if I-H is used, and between 0.60 and 0.80 mag
when one uses B-I.
For those galaxies for which no dust lanes or patches were found, we tried a more sensitive method, by carefully analyzing the isophote shapes. Dust generally causes patchy structures, which means that the galaxy isophotes are not symmetric any more, and that the third order Fourier terms C3 and S3 (Carter 1978) will be non-zero, and generally increasing when going to the blue. No dust lanes or patches were found for NGC 5475, 5854, 6504 and 7457. However, S3 and C3 in B and I were found to be significantly non-zero in all of these, except for NGC 7457.
 |
Apart from providing high resolution, HST also has the advantage that the
photometric conditions are very stable, so that accurate colors can be
determined. For this reason we can use the color-color
diagram to infer information about the age-spread in the sample, and about the
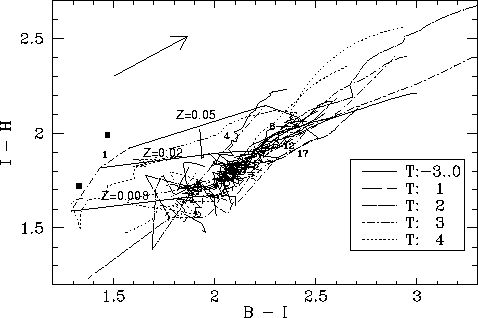
cause of the stellar population gradients. In Fig. 4 our galaxies are
plotted together with Single Stellar Population (SSP) models of Vazdekis
et al. (1996). We see that for I-H < 2.1, in the region where reddening
is not necessarily important, the color-color diagram is extraordinarily tight.
Only NGC 5577, an Sbc galaxy, with much lower surface brightness than the
rest, is much bluer in B-I than the other galaxies. For a given I-H the
scatter in B-I is ![]() 0.05 mag at I-H = 1.9 and 0.08 mag at I-H = 1.7.
Independent of the amount of extinction, the tightness of the
relation shows that the average age of the stars is very similar from
bulge to bulge. According to the model the age-spread would be about 2-3 Gyr,
although the ages in the outer parts of the bulge are somewhat younger than
further inwards. An average age of about 8 Gyr is found. One should however
keep in mind that this kind of
stellar population model is generally not very good at determining absolute
ages. No type-dependence of this result is found,
except that for the latest type (Sbc) B-I tends to be bluer for a given I-H,
showing that the Sbc bulges are generally younger than earlier-type bulges.
0.05 mag at I-H = 1.9 and 0.08 mag at I-H = 1.7.
Independent of the amount of extinction, the tightness of the
relation shows that the average age of the stars is very similar from
bulge to bulge. According to the model the age-spread would be about 2-3 Gyr,
although the ages in the outer parts of the bulge are somewhat younger than
further inwards. An average age of about 8 Gyr is found. One should however
keep in mind that this kind of
stellar population model is generally not very good at determining absolute
ages. No type-dependence of this result is found,
except that for the latest type (Sbc) B-I tends to be bluer for a given I-H,
showing that the Sbc bulges are generally younger than earlier-type bulges.
In the previous section we have shown that
The first conclusion shows one more similarity between bulges of early-type
spirals and ellipticals. Van Dokkum & Franx, analyzing WFPC data of
elliptical galaxies, give an average dust mass of 4 ![]() 103 M
103 M![]() .
For the bulges analyzed here we find an average dust mass of
.
For the bulges analyzed here we find an average dust mass of
![]() 104 M
104 M![]() ,
i.e. a slightly larger number. We should however note
that van Dokkum & Franx determined their dust masses only from one V-band
image, so their numbers are very rough. If we assume a Galactic gas to dust
ratio of 130 (see van Dokkum & Franx 1995) we find the galaxies analyzed in
this paper have an average of 106 M
,
i.e. a slightly larger number. We should however note
that van Dokkum & Franx determined their dust masses only from one V-band
image, so their numbers are very rough. If we assume a Galactic gas to dust
ratio of 130 (see van Dokkum & Franx 1995) we find the galaxies analyzed in
this paper have an average of 106 M![]() of interstellar material
in their nuclear regions. This is generally much smaller than the stellar
mass in these areas. Note that the amount of ISM in the galaxies outside the
nuclear area in general is much larger, as shown by the large dustlanes etc.
of interstellar material
in their nuclear regions. This is generally much smaller than the stellar
mass in these areas. Note that the amount of ISM in the galaxies outside the
nuclear area in general is much larger, as shown by the large dustlanes etc.
Several of our bulges have central features which resemble the inner disk in the giant elliptical NGC 4261 (Jaffe et al. 1996). Examples are NGC 5326, NGC 5587, and NGC 5838. NGC 4261 has a LINER spectrum in the center, and it is argued by Jaffe et al. that this inner disk might provide the fuel for the AGN. The objects studied in our paper however are not known to be active, and also their colors are consistent with being from stellar origin, extincted by dust. As a comparison, we have plotted the colors of two knots of the jet in M 87 in Fig. 4, for which the emission is thought to be due to synchrotron radiation (see Stiavelli et al. 1997). They are much bluer in B-I than the nuclei of the bulges. We conclude that in general the material to fuel an AGN in our bulges is present, although it is not clear whether black holes are present. An indication that they are could be the fact that many bright nearby S0 galaxies harbor faint radio sources in their centers (Sadler et al. 1989).
The largest nuclear disk that we observe, in NGC 5838, shows another interesting
feature. B-I and I-H color maps are shown in Fig. 5.
Two dust lanes are visible, the outer having a diameter of
![]() 1 kpc.
The central dust lane, very prominent in the I-H map, is rather weak in
the B-I map. Furthermore,
in the B-I map several darker areas are seen, i.e. of bluer color. The
fact that these features are only seen in a blue color indicates that
we are seeing the presence of young stars being formed in the inner disk.
This explains also why the inner dust lane is less strong in B-I. Although
it is clear that the main body of the galaxy is old, we see that even at present
the galaxy is forming stars, although at a very low rate. For the other galaxies
unfortunately we don't have the resolution to detect the presence of young stars
in this way, but it is likely that the dust and gas, which has been found in a
large fraction of ellipticals and early-type spirals, is a suitable environment
for the formation of young stars, and that galaxies, even early-types, are
still forming stars in their nuclei right now.
1 kpc.
The central dust lane, very prominent in the I-H map, is rather weak in
the B-I map. Furthermore,
in the B-I map several darker areas are seen, i.e. of bluer color. The
fact that these features are only seen in a blue color indicates that
we are seeing the presence of young stars being formed in the inner disk.
This explains also why the inner dust lane is less strong in B-I. Although
it is clear that the main body of the galaxy is old, we see that even at present
the galaxy is forming stars, although at a very low rate. For the other galaxies
unfortunately we don't have the resolution to detect the presence of young stars
in this way, but it is likely that the dust and gas, which has been found in a
large fraction of ellipticals and early-type spirals, is a suitable environment
for the formation of young stars, and that galaxies, even early-types, are
still forming stars in their nuclei right now.
In a recent series of papers Carollo and coworkers (Carollo et al. 1997b) divide bulges in three categories, on the basis of their R-band surface brightness profiles: the Classical R1/4 bulges, small exponential, and dominant exponential bulges. Of the whole sample discussed here, only one galaxy, NGC 5577, would not fall into the category of R1/4 bulges: Surface brightness profiles in the inner regions are very similar to ellipticals. This result supports the view that early type bulges have R1/4 profiles, while late types have profiles which approach the exponential shape (Andredakis et al. 1995). Comparing color profiles is somewhat more difficult. The only paper presenting a reasonable sample of ellipticals is Carollo et al. (1997a), presenting V and I profiles of 15 galaxies observed with the refurbished WFPC2. It seems that the color gradients are similar, although they are difficult to compare, since Carollo et al. (1997a) masked out dusty areas before obtaining the color profiles.
The fact that the ages are all so similar indicates that there has been a major episode of star formation in the universe, in which most of these bulges were formed. This could be in agreement with the star formation history predicted by Madau et al. (1996) on the basis of data of the Hubble Deep Field, which shows a maximum between z = 1 and 3. Note that the objects studied here are generally field objects, which means that they do not necessarily have to have similar ages as galaxies in clusters, which must have formed beyond z = 3 (Ellis et al. 1997).
The authors acknowledge very useful support from Luis Colina, Massimo Stiavelli and Doris Daou at the STScI, and useful discussions with Ian Smail.
